Running a small or medium-sized manufacturing enterprise (SME) means managing an absolute mountain of data. Every day, your Caliach Vision ERP system tracks essential operations: Bills of Materials (BoMs), work orders, procurement cycles, customer accounts, and tax compliance across multiple currencies.
But there is a distinct difference between having data and actually having insight.
If your team is still spending hours extracting spreadsheet reports, manually manipulating rows, and trying to spot trends in static grids, you are losing valuable time. Here is why upgrading your reporting capabilities with Power BI dashboards is the single most effective way to unlock the true value of your Caliach Vision data.
See Your Business and Identify Hotspots Instantly
An ERP system is fantastic at capturing granular details, from parts valuation to un-received purchase orders. However, looking at raw tables makes it incredibly difficult to see the big picture.
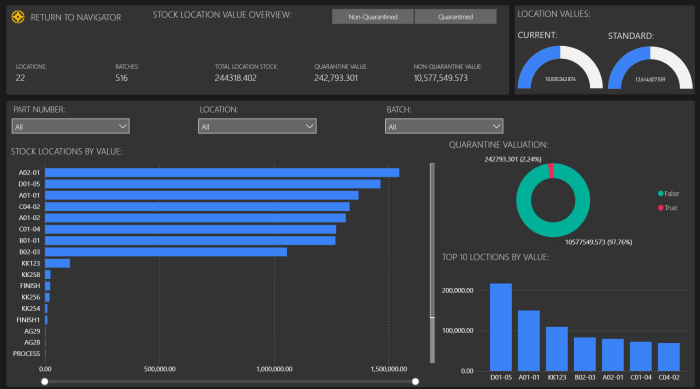
Power BI transforms this data into a visual, digestible format. Instead of scanning lines of text, a dynamic dashboard highlights your business “hotspots” automatically. Whether it is a sudden spike in material variance costs, a bottleneck in production scheduling, or a specific supplier failing to meet delivery speeds, visual alerts call your attention exactly where it is needed most. You see the problem in seconds, not after an afternoon of manual analysis.
An Immediate Dashboard: We Have Done the Hard Work For You
One of the biggest hurdles to adopting new software is the learning curve. Business leaders often worry that implementing business intelligence tools means sending staff on complex training courses or hiring expensive data analysts.
That is not the case here. We have already done the heavy lifting by building an immediate dashboard framework tailored for Caliach Vision. You do not need to go on a course or learn complex programming. The integration maps directly to your core operational settings and master records, giving you instant clarity from day one.
From Visual High-Levels to Deep Drill-Downs
A major benefit of Power BI is the seamless balance between high-level summaries and granular detail.
Your initial dashboard view gives you a clean, digestible format of your key performance indicators (KPIs). But the utility does not stop at surface-level charts. If a specific hotspot catches your eye, Power BI allows you to drill down into the detailed information with a single click. You can move from an overarching view of monthly sales history straight down to the specific customer code, part index, or invoice number driving that metric.
Actionable Intelligence to Drive Your Growth
Data is only useful if it provokes the right action. Traditional reporting tells you what happened last month, which is often too late to change the outcome. Power BI delivers actionable intelligence, turning historical records into forward-looking insights.
By visualizing trends in customer parts performance, inventory quantities, and manufacturing cycles, you can make proactive adjustments. You can reallocate factory resources, renegotiate terms with underperforming suppliers, or adjust dispatch schedules before a hotspot becomes a critical issue.
Stop Managing Spreadsheets. Start Managing Your Business.
Your Caliach Vision ERP is a goldmine of operational excellence. Upgrading to Power BI dashboards ensures you are no longer just storing data, but actively using it to create competitive insights.
By translating complex ERP metrics into a digestible format, highlighting critical hotspots, and delivering immediate, actionable intelligence, Power BI saves your leadership team hours of administrative effort. The hard work is already done. It is time to turn your data into your greatest unfair advantage.
* Power BI requires an additional Caliach Vision License