Work Centre Loading Chart
![]() Reference Contents > Capacity Planning > Work Centre Loading Chart
Reference Contents > Capacity Planning > Work Centre Loading Chart
This window shows an analysis of a Work Centre’s Operation loading over its period of activity within the calendar and extent date.
A Work Centre must have been previously selected by clicking on an appropriate list line which is specific to a Work Centre or in the Work Centre List window.
You can view capacity by operating the Analysis by Department menu function. If this is the case the loading will be for all Work Centres that have the same Department as the currently selected Work Centre.
The window has 2 tab panes.
Listing
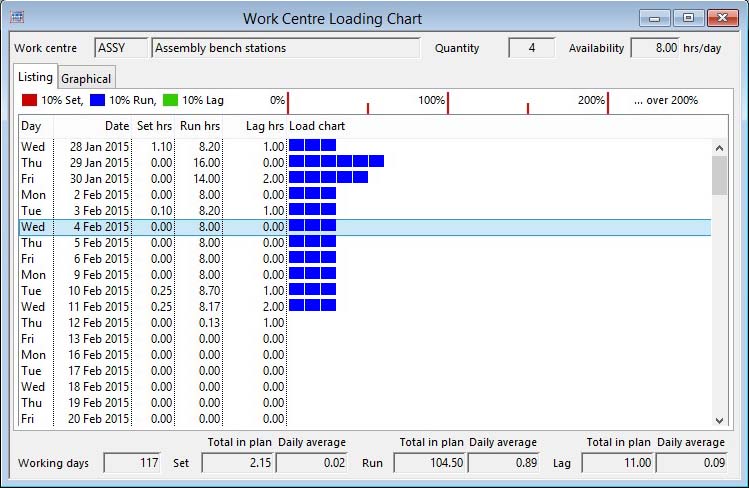
This shows the loading in a list form.
The analysis uses the Work Operation list data. The Set, Run and Lag hours of loading for each day are shown and a bar chart produced on the right of the list. Each icon block of a bar represents 10% of the available load for that Work Centre. Available load is considered to be Work Centre Available hours times Quantity. The colours represent Set, Run and Lag times. Totals and daily average over the calendar period are shown at the bottom of the window.
If the Ignore Lag in Loading Chart menu option has been set, which is indicated by a check mark on the menu line, all lag times will be ignored in the presentation of the chart and the report.
This window can be left open and you can readily switch between it and others by clicking on the desired window with the mouse. All capacity planning windows operate interactively.
Double-clicking on a loading date line will bring forward the Work Order List window containing a list of all Work Orders or Jobs due to be processed on that day by that Work Centre. This list can be used to select a Work Order or Job Operation and change its due date if re-scheduling is needed. See the Work Order List for details.
|
Field |
Description |
|---|---|
|
Work Centre or Department |
Work Centres. Work centre unique identifier code. {WKCFILE.WKCCODE char 4} |
|
Description |
Work Centres. Description of work centre. {WKCFILE.WKCDESC char 30} |
|
Quantity |
Work Centres. Quantity of these work centres available for planning. {WKCFILE.WKCQTY number 0dpShortnum} |
|
Available |
Work Centres. Hours available in each Make day for the work centre. {WKCFILE.WKCTIME number 2dpShortnum} |
|
Loading List |
Lists Work Centre loading for all working days in the Make calendar. |
|
Total Working Days |
The number of Make days in the listing. |
|
Total Set Hours |
The total set-up hours for all operations in the forecast. |
|
Daily Set Average |
The daily average set-up hours for all operations over the working days listed. |
|
Total Run Hours |
The total run hours for all operations in the forecast. |
|
Daily Run Average |
The daily average run hours for all operations over the working days listed. |
|
Total Lag Hours |
The total lag hours for all operations in the forecast. |
|
Daily Lag Average |
The daily average lag hours for all operations over the working days listed. |
Graphical
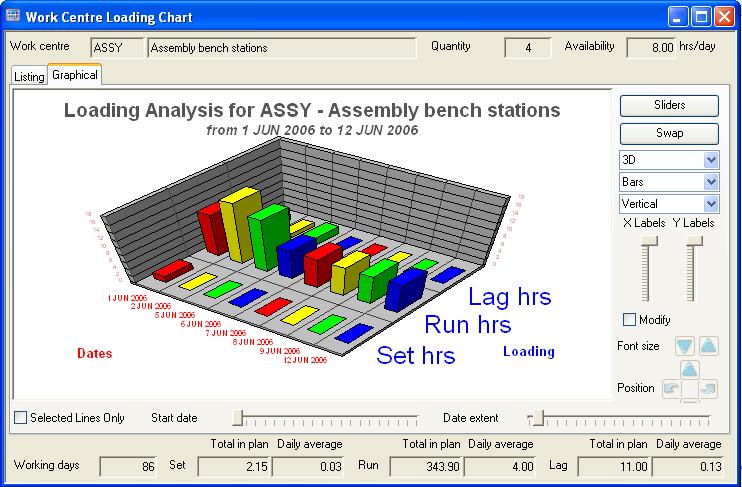
This pane shows the loading in graph form. See the Graphs subwindow topic for functional details.
![]()
![]() LINUX and SUN SOLARIS ONLY: Graphing is not supported on terminals using the Linux or Sun Solaris operating systems.
LINUX and SUN SOLARIS ONLY: Graphing is not supported on terminals using the Linux or Sun Solaris operating systems.
|
Field |
Description |
|---|---|
|
Selected Lines Only |
Check to show only the selected dates in the list. |
|
Start Date slider |
To adjust the start of dates shown. The range is from the beginning date on the list up to the date 95% through the list. |
|
Extent slider |
To adjust the extent of the dates shown. The range is from the 5% to 100% of the number of dates in the list. |
| See also: – |
Compiled in Program Version 5.10. Help data last modified 4 Jun 2012 04:47:00.00. Class wCplWkcLoading last modified 23 Sep 2017 10:50:49.
![]() Reference Contents > Capacity Planning > Work Centre Loading Chart
Reference Contents > Capacity Planning > Work Centre Loading Chart