OVERVIEW
Key Performance Indicators are either lists of data or Graphs that are collected and displayed to users automatically to show them some key piece of relevant information that allows them to make judgements from. They display to users on the Key Performance Indicators window, either as single KPI or as a group of several KPIs together.
Automatic Display Timing
At regular intervals while a user is active in Caliach Vision (similar to checking for Messages) the system checks to see if any KPIs are appropriate for display to the user. The user must be assigned to a KPI or belong to a group that is assigned to a KPI. Then, if the timing is right, the KPIs will be displayed automatically.

The timing is controlled by the Starting reference point, the Redisplay frequency and unit and the Display duration and unit. The chart above shows how it works. The Starting reference point is a date/time in the past that acts as a reference date and time (and day) from which the frequency of display is calculated. So in the chart above the Start Reference is, say, a date for a Monday sometime in the past. The Redisplay frequency is 1 and the Redisplay unit is Weeks (or it could be 7 and Days, which is the same). The Display duration in the example is 2 and Display units is Days. This means that the KPI will display on a Monday and Tuesday of each week.
TIP: Typically, you cannot guarantee that users will see the KPI on a particular day, say every Monday morning, because there may be some weeks where the Monday is a holiday, or the user takes the day off. So, leaving the Display duration to a reasonable period can ensure that everyone that should see the KPI, does get a chance to see it. On the other hand, if you give too long a duration repeated displays may annoy users.
In any user session, once the KPI has been displayed, it will not be re-displayed again until after the current working session or the end of the Display duration whichever is the earlier point.
NOTE: Key Performance Indicators where possible should have automated data searches so that there is no need for user intervention in selecting the data for them. However, Data View KPIs or Graph KPIs that use Data Views can contain Search Interfaces. If they do, the Search Interface window will open after the KPI window opens. At this point the KPI will not contain data. Only after the user makes their selection and or uses ScratchPad Transfer will the KPI be redrawn to show the data. This may be confusing to the user, so care should be taken with the use of KPIs with Search Interfaces.
File Path
File > System Manager > Key Performance Indicators…
Key Performance Indicator Maintenance window.
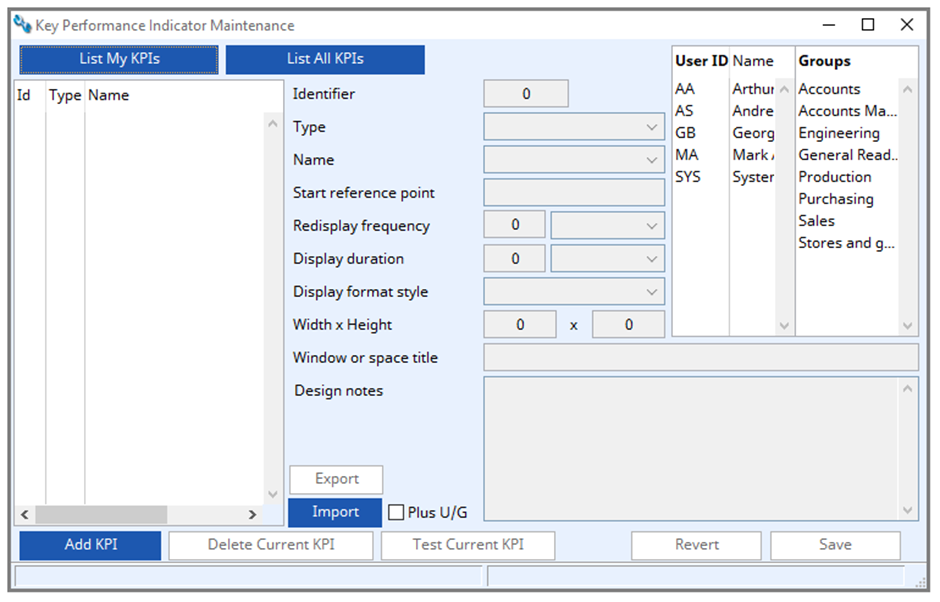
List My KPI’s button
Click to list the KPIs that you have access to.
List All KPI’s button
Click to list all the KPIs in the datafield.
KPI List
List of Key Performance Indicators.
Identifier
Unique Id number from MCNKPI.
Type
Select from the dropdown list the KPI types. Type of display object (GRA = Graph 2, DVI = List with Data View)
Name
Select from the dropdown list the name of the object you want to use. Either a Data View which will display as a list, or a Graph 2 design. Name of Graph 2 or Data View.
Start reference point
Start date/time reference point.
Redisplay frequency
The number of frequency units that make up the time period frequency (e.g. 10 days or 2 weeks).
Redisplay frequency Units
Time period units of frequency of redisplay (date-part constant, 1=kYear, etc)).
Display duration
Time periods of display (date part constant, 1=kYear, etc).
Display duration Units
Time unit of periods of display (date part constant, 1=kYear, etc).
Display format style
Display format style (0=Fill full space, 1=Fill width respect aspect ratio, 2=Fill height respect aspect ratio, 3=Absolute size, 4=Absolute width fill height, 5=Absolute height fill width, 6=Show in it’s own window).
TIP: Normally the collection of displayable KPIs are all displayed in a single window, distributed according to the rules here. However, the Show In It’s Own Window setting, tells the system to open an exclusive window for the KPI alone in the dimensions of width and height set for it below.
Width x Hight
Width in pixels or relative to height and height in pixels or relative to width.
Window or space title
Display window or space title for the KPI.
This text is placed above the KPI to give it a recognisable title when multiple KPIs are displayed on a single Key Performance Indicators window. However, if the Display format is set to ‘Show In It’s Own Window’ the full window space is available for the Graph or List and the window title shows this title text.
For Graphs this title may not be needed, as Graphs typically have titles as part of the graph itself, so you can leave this blank but only if the Display format style is NOT set to Show In It’s Own Window, as then it is needed for the window title.
Design notes
Design notes.
Export button
Export selected KPIs, user and group permissions, related graphs and data views (and also those referenced by the graphs). Saved to a .kpi database.
Import button
Import from previously exported KPIs. Inserts data or updates it in KPIs, user and group permissions, related graphs and data views. Imported from a .kpi database.
Plus U/G tick box
Check to also import User and Group assignments when they exist in the current data AND also your User Id will be assigned. Otherwise, new KPIs will be unassigned. Updated KPIs will not have existing assignments removed, but if checked they could be added too.
User list
List of users that can log on. Select those you want the KPI to be seen by.
Group list
List of groups. Select those you want the KPI to be seen by.
Add KPI button
Click to add a further KPI record.
Delete Current KPI button
Click to delete the selected KPI record.
Test Current KPI button
Click to test the currently selected KPI.
Revert button
To revert any changes to the previously saved version.
Save button
To save the changes you have made to the data file.
Compiled in Program Version 6.00. Help date last modified on 18 December 2023
Class wkpimaint (Key Performance Indicator Maintenance) last modified 25 May 2022 FP: File > System Manager > Key Performance Indicators…