Method Performance Analysis
![]() Reference Contents > Manager Controls > Method Performance Analysis
Reference Contents > Manager Controls > Method Performance Analysis
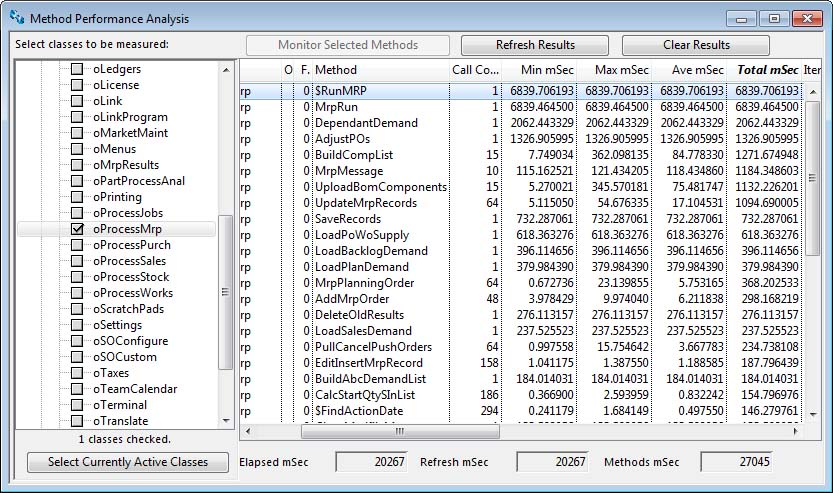
This is a specialist feature to measure the internal method performance for activities within the program. Methods are program processing routines that can themselves call other methods. They can be automatically called, as when a window or report opens the $construct method of the class is run. When you select a class for monitoring, any subsequent processing activity in methods within the class records statistics on their performance. This can then be retrieved and listed when the Refresh Results is clicked.
Normally, you would only use this feature under instruction from Caliach Vision Support when they are trying to establish why a particular performance issue is causing concern. This is often data-dependant and therefore an analysis of your local processing may be useful.
|
Field |
Description |
|---|---|
|
Library, Type, Class tree list |
Tree list of open libraries, class types and classes in the libraries. The libraries are the current library and any plug-in libraries. To select a class click on the checkbox. If you check or uncheck a library or type, all classes in the library or of this type are checked. |
|
Result List |
List of methods with activity recorded. Right-click to print or export the results. |
|
Elapsed mSec |
The elapsed time in milliseconds since the monitoring was started until the last refresh. |
|
Refresh mSec |
The time in milliseconds between monitoring starts or between refreshes. |
|
Methods mSec |
The total time in milliseconds between for the listed method results. |
|
Button |
Action |
|---|---|
|
Select Currently Active Classes |
Click to select only classes that are currently active, or may be active, such as open windows. This always selects code classes because they can be active at any time and are not specific to a particular activity. With other class types, they are selected only if there are instances of them open. |
|
Monitor Selected Methods |
Having selected classes in the tree list, click to start the process of monitoring method execution in those classes. |
|
Refresh Results |
After setting the process of monitoring started, you can operate the program in the normal way. Then when your operations are completed, click this button to collect and display the results. This can be repeated at any time to explore the program method performance. |
|
Clear Results |
Click to clear already produced results and re-start the monitoring process. |
| See also: – |
Compiled in Program Version 5.10. Help data last modified 17 May 2012 08:45:00.00. Class wClassMethodPerform last modified 23 Sep 2017 10:50:48.
![]() Reference Contents > Manager Controls > Method Performance Analysis
Reference Contents > Manager Controls > Method Performance Analysis