G/L Custom Report Design Maintenance
![]() Reference Contents > Ledgers Manager > G/L Custom Report Design Maintenance
Reference Contents > Ledgers Manager > G/L Custom Report Design Maintenance
This feature provides for custom P and L and Balance Sheet reports to be designed. It is a feature of Caliach Vision that enables the user to generate Trading and Balance Sheet reports from closed G/L periods to any design. It supplements the standard reports of Caliach Vision. Once report classes and data collection methods have been prepared in the design environment, report contents can be determined at runtime by the Ledger Manager.
Printing of reports is available from the G/L menu. See the G/L Custom Report Selection window for more details.
|
Field |
Description |
|---|---|
|
Select report |
List of all custom designs. Select to view details. |
|
Design name |
G/L Report Special Designs. Design Name. {RSDFILE.RSDNAME char 60} |
|
Report class |
G/L Report Special Designs. Report class name. {RSDFILE.RSDFORM char 60} |
|
Report class description |
The description of the report class. If there is no description shown it is likely that the class is not present in your copy of Vision.lbs. If you are using custom report classes these must be included in the Change Management System ProgCode.usa file. |
|
Calculating method |
G/L Report Special Designs. Calculation method name. {RSDFILE.RSDCALC char 60} |
|
Help text |
The description of the calculation method. This is help text stored in the String file with a string name of the method name prefixed with rAcGlRep. E.G. rAcGlRepBalSheet12Periods |
|
Heading |
G/L Report Special Designs. Heading. {RSDFILE.RSDHEAD char 120} |
|
Start notes |
G/L Report Special Designs. Page heading text notes. {RSDFILE.RSDHDTX char 10000000} |
|
End notes |
G/L Report Special Designs. Total section text notes. {RSDFILE.RSDTOTX char 10000000} |
|
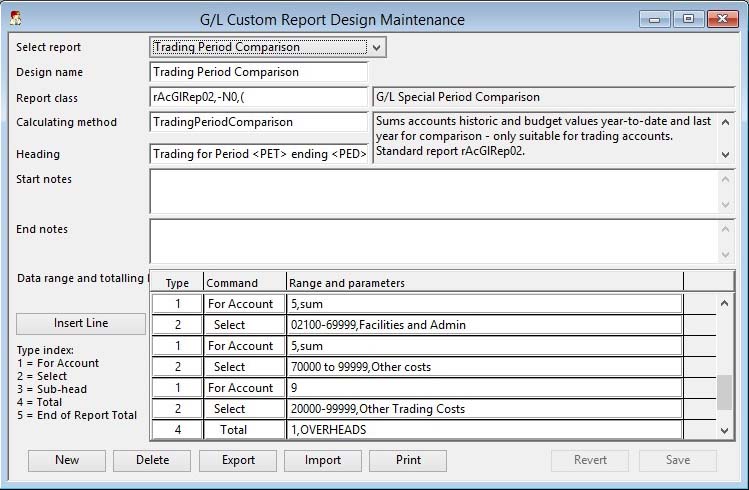
Data range and totalling list |
List of data ranges and totalling control. To remove a line set the type to 0. |
|
Type |
Data line type: 1 = Cost Centre, 2 = Select range, 3 = Subtotal level, 4 = Total level, 5 = End of report. |
|
Range and parameters |
Range and/or parameters relevant to the type selected. |
|
Insert Line at Cursor |
To insert a line in the data list at the currently selected point. To add lines to the end of the list, tab out of the last line. |
|
Button |
Action |
|---|---|
|
New |
This will create a Copy of the current record displayed on the window. You will then be able to change the details. Confirm with an OK, or abandon the new record with a Cancel. |
|
Delete |
Execute this button to permanently remove the currently selected record from the file. If you are permitted to delete the item, you will be asked for confirmation, otherwise an explanation will be given. |
|
Export |
Export design data, so that it can be imported into an alternative data file. |
|
Import |
Import design data from an alternative data file. |
|
|
Print a listing of the design for the selected report. |
|
Revert |
To revert any changes to the previously saved version. |
|
Save |
To save the changes you have made to the data file. |
Design Parameters
|
Element |
Function |
|---|---|
|
Design name |
The name the user will see the report in the selection dialog. Must be unique and no more than 30 characters. |
|
Report format |
The format name of the Omnis report class that will be used for printing. This class should exist in the current library, if not the user will be warned. |
|
Heading |
The text that will display on the report as a heading. Tagged variables are permitted, see below. |
|
Start notes |
Text that will be printed as notes on the first page of the report. Tagged variables are permitted. |
|
End notes |
Text that will be printed as notes on the last page of the report. Tagged variables are permitted. |
|
Tagged variables |
Text parameters of the design can contain tags that are bounded by < and > characters and which are interpreted at report runtime. Currently available tags are: |
|
Calculation method |
This is the name of the method (program procedure) run in the G/L Custom Report Selection dialogue window wAcGlRepPrint. The method name must be exact and is case sensitive. This method sets the dialogue selection options and other program controls including the method used to gather the data and print the report. Optionally the method name can be followed, after a comma, by a number of parameters which will be passed to the calculation method when the report is selected. |
|
Data range and totalling list |
This list governs what data is selected from G/L history, how it is totalled and the titles used. The report’s data is selected in the order that the list is prepared. Each line has Type and Range or Text elements as per the following table: |
|
Type |
Range or Text |
|---|---|
|
1 = For account |
The system assumes that you have structured your G/L account codes (that is the full code being the 6 character account and 4 character cost centre combined) into the form of XXXXXXYYYY where XXXXXX is an account and YYYY a cost centre. Any number of characters can be used for either. Before selecting a range of cost centres you must identify the account (e.g. 68 or 68,SUM).Using the * character has a special meaning. *, **, ***, **** or ***** will mean all accounts for a particular range. You can mix account characters such as 6*****, or 6***20, or ****20. The ,SUM option tells the system to sum all the accounts in a range into one line, if omitted each account will be printed separately. For Example:
|
|
2 = Select |
Enter a range of account/cost centre codes, or at least the part of the full codes that follow the previously defined account characters. The range can be in the form of:
The optional parameter following a comma is the title for the line of summed accounts ,SUM option. If the first character of the entry is a minus (-), the data printed on the report will have its sign reversed (i.e. a debit will show as negative). You can have more than one Select line following a For Account line. In that case the Selects are logically combined with an OR. For example if your For Account range is 6 characters then the Select will for the cost centre part:
|
|
3 = Sub-heading level and title |
This triggers the start of a subtotalling group. There can be up to 8 level of subtotal. 1 being the outermost (or coarsest) and 8 being the innermost (or finest). Enter the level followed optionally by the title, separated by a comma, that will appear at the start of the subtotal group. E.G. 2,SALES |
|
4 = Total level and title |
This terminates a subtotal group and causes the printing of the subtotal. Enter the level followed optionally by the title, separated by a comma, that will appear at the subtotal line. E.g. -2,Sales of all goods. If no optional title is entered, the report will print the Sub-heading title. |
|
5 = End of Report and final total title |
This is an optional entry that will set the title of the final report grand total. E.g. -Profit (Loss) |
Customisation and API
This system uses a window class that can be customised in OpenVision.lbs. Methods and user selection objects can be added to the standard design. Report formats can be copied and changed.
|
Class |
Method used |
Description |
|---|---|---|
|
wAcGlRepPrint |
— |
G/L report selection dialogue window |
|
rAcGlRep01 |
Trading12Periods |
G/L Special 12 periods report |
|
rAcGlRep02 |
TradingPeriodComparison |
G/L Special Period Comparison report |
|
rAcGlRep03 |
TradingYearResults |
G/L Special Year on Year report |
|
rAcGlRep04 |
BalSheet12Periods |
G/L Special 12 Balance Sheet report |
|
rAcGlRep05 |
MixedQuarterly |
G/L Special Quarterly Mixed report |
|
rAcGlRep06 |
TradingYTDQuarters |
G/L Special Trading YTD Quarters report |
|
rAcGlRep07 |
BalSheetQtlyComparison |
G/L Special Bal Sheet Quarterly Comparison report |
|
rAcGlRep08 |
TradingPeriodYTD |
G/L Special Trading Period and YTD report |
|
rAcGlRep09 |
MixedPeriod |
G/L Special Period Mixed report |
|
rAcGlRep10 |
TradingPeriodYTD2 |
G/L Special Trading Period and YTD with Budgets report |
|
rAcGlRep11 |
TradingCur3MonthYTD |
G/L Special Trading Current 3 Months and YTD report |
|
rAcGlRep12 |
TradingPeriodYTD3 |
G/L Special Trading Years and YTD with Budgets report |
Program flow
![]() CUSTOM CAPABILITY: OpenVision.lbs contains the source code for the Custom Report Selection window wAcGlRepPrint, in which custom methods must be written, and sample report designs rAcGlRep01 etc. which can be duplicated to create your own classes.
CUSTOM CAPABILITY: OpenVision.lbs contains the source code for the Custom Report Selection window wAcGlRepPrint, in which custom methods must be written, and sample report designs rAcGlRep01 etc. which can be duplicated to create your own classes.
|
Event |
Processes |
|---|---|
|
When a report is selected by the user. |
Calculation Method (RSDCALC) passing parameters |
|
When the Print button is operated. |
Runs method PrintReportControl which: |
|
Inside the print method. |
The following mandatory actions must take place: |
In all standard report methods and class designs the data is held in list #L1 and fields #1 through #13 are used to hold the account data and correspond to columns 1 to 13 respectively. Standard Calculation Methods and Reports designed for them are:
|
Calculation Method |
Trading12Periods |
|---|---|
|
Selection type |
100 |
|
Print method |
PrintReport |
|
Report class |
rAcAcGlRep01 |
|
P and L or Bal. Sheet |
P and L (total column not valid for Bal. Sheet |
|
Description |
Columns 1 to 12 are populated with single history values for each period in the range selected. Plus column 13 for the Total of all 12 periods. |
|
Calculation Method |
TradingPeriodComparison |
|
Selection type |
101 |
|
Print method |
PrintReport |
|
Report class |
rAcAcGlRep02 |
|
P and L or Bal. Sheet |
P and L only |
|
Description |
Column 1 = Selected period |
|
Calculation Method |
TradingYearResults |
|
Selection type |
102 |
|
Print method |
PrintReport |
|
Report class |
rAcAcGlRep03 |
|
P and L or Bal. Sheet |
P and L only |
|
Description |
Column 1 = 4th previous year |
|
Calculation Method |
TradingYTDQuarters |
|
Selection type |
103 |
|
Print method |
PrintReport |
|
Report class |
rAcAcGlRep06 |
|
P and L or Bal. Sheet |
P and L only |
|
Description |
Column 1 = Year-to-date this year |
|
Calculation Method |
TradingPeriodYTD |
|
Selection type |
104 |
|
Print method |
PrintReport |
|
Report class |
rAcAcGlRep08 |
|
P and L or Bal. Sheet |
P and L only |
|
Description |
Column 1 = Year-to-date actual |
|
Calculation Method |
TradingPeriodYTD2 |
|
Selection type |
105 |
|
Print method |
PrintReport |
|
Report class |
rAcAcGlRep10 |
|
P and L or Bal. Sheet |
P and L only |
|
Description |
Column 1 = Selected period actual |
|
Calculation Method |
BalSheet12Periods |
|
Selection type |
110 |
|
Print method |
PrintReport |
|
Report class |
rAcAcGlRep04 |
|
P and L or Bal. Sheet |
Balance Sheet only |
|
Description |
Column 1 = Opening balance |
|
Calculation Method |
BalSheetQtlyComparison |
|
Selection type |
111 |
|
Print method |
PrintReport |
|
Report class |
rAcAcGlRep07 |
|
P and L or Bal. Sheet |
Balance Sheet only |
|
Description |
Column 1 = Selected month opening balance |
|
Calculation Method |
MixedQuarterly |
|
Selection type |
120 |
|
Print method |
PrintReport |
|
Report class |
rAcAcGlRep05 |
|
P and L or Bal. Sheet |
Both P and L and Balance Sheet |
|
Description |
Column 1 = This quarter (to selected period) |
|
Calculation Method |
MixedPeriod |
|
Selection type |
121 |
|
Print method |
PrintReport |
|
Report class |
rAcAcGlRep09 |
|
P and L or Bal. Sheet |
Both P and L and Balance Sheet |
|
Description |
Column 1 = Selected period opening balance or prior year-to-date |
|
Calculation Method |
TradingCur3MonthYTD |
|
Selection type |
106 |
|
Print method |
PrintReport |
|
Report class |
rAcAcGlRep11 |
|
P and L or Bal. Sheet |
P and L only |
|
Description |
Column 1 = Selected period actual |
|
Calculation Method |
TradingPeriodYTD3 |
|
Selection type |
122 |
|
Print method |
PrintReport |
|
Report class |
rAcAcGlRep12 |
|
P and L or Bal. Sheet |
P and L only |
|
Description |
Column 1 = Previous year |
| See also: – |
Compiled in Program Version 5.10. Help data last modified 4 Jun 2012 04:47:00.00. Class wAcGlRepM last modified 10 Oct 2017 11:47:52.
![]() Reference Contents > Ledgers Manager > G/L Custom Report Design Maintenance
Reference Contents > Ledgers Manager > G/L Custom Report Design Maintenance