Caliach ERP Tutorial
This tutorial is designed for those who are completely new to Caliach Vision ERP and want to know how to use the free Demonstration Software.
History and Analysis
- Inventory (Stock) Movements
- Sales, Purchases, Works and Jobs
- Flexibility of Reports
- Graphing
- Analysing Data Elsewhere
Keeping a history of activity in the system is an important part of an ERP system. The following is a list of history which is maintained.
| Batch Tracking BoM Changes Commissions Credit Control Memos Currency Changes Invoices Jobs, Items and Bookings Journals Ledgers G/L Period History Ledger Transactions Ledgers Transaction Allocations Marketing Events Non-Conformance Reports | Part Current Costs Period Update History Product Serial Numbers and Tracking Purchase History Quality Assurance Test Results Sales History Stock Movement History Stocktakes Transfer Stock Details Work History Work Operation Tracking |
Most history can be viewed in review list windows and in reports of various sorts with range selections and alternative sort options. You can generally find such reviews and reports from the menu where the history was created. For example purchase history is available from Process→Goods Receiving and History→Review PO History or Print History Reports.
Where history is created from many assorted functional areas, such as inventory history, which is an audit trail of stock movements, it has its own menu group. In this case Process→Inventory History→Review Part Movements or Print Movement Reports.
Common forms of history are also available using drill-down techniques. For example, if you were in the Stock Control window there is a button for Show History List. Once open this window will redraw to reflect parts ScratchPad selections.
Inventory (Stock) Movements
Every change in part stock quantity generates an inventory history record of the movement. It will show when and what happened and may also be linked to a document associated with the movement. Inventory movement history is also maintained for non-physical movements such as when a part is ordered or allocated. This means that it maintains an order preparation history, but note that this is only ever for part items on orders.
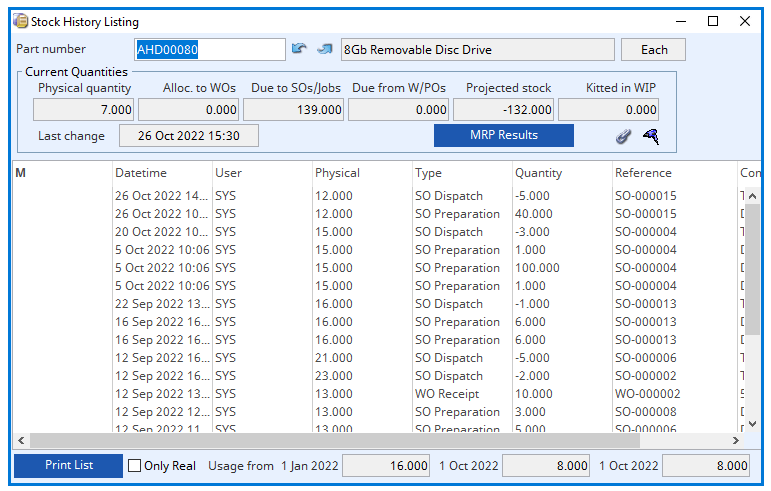
Let us now open a review window by operating the Process→Inventory History→Review Part Movements menu function. Enter an A in the part number field and press the tab key. The movement history of AHD00080 will be shown. This includes the quantity involved moving into (+ve) and out of (-ve) physical stock or notional stock when the movement is recording a non-real movement. The non-real movement data is useful but it can cloud the picture so there is an Only Real checkbox at the bottom left that filters out allocations and order preparation records. You will see also that there is a Physical column which shows the calculated physical stock before the movement took place. Although you can change the sort order by clicking on a column heading, the list is most usefully viewed when sorted by date.
Notice that the Reference column shows the document associated with the movement using a standard prefix of PO-, SO-, JB-, WO-, etc. You can drill-down to review the document by double-clicking on the list line. From there you can even drill further to view other associated documents.
If you now operate Process→Inventory History→Print Movement Reports ? we can now explore a typical history reporting window. The window has 4 groups of controls.
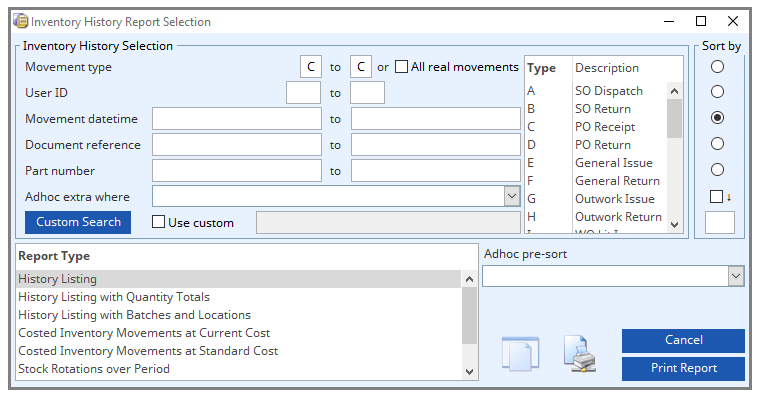
In the upper left you can control the selection of records. This can be done by entering any number of from and to values (uniquely on this report window you have a list of type codes and can drag and drop them to restrict to only one type of movement). You can also create and/or apply custom searches or, by right clicking, apply an Ad Hoc Where Clause. In addition you can restrict the report further by dragging a selected set of parts from the ScratchPad.
On the upper right, there is a group of radio buttons along side the selection range lines. This determines the sort order for the report and when the report design contains values usefully totalled, the sort selection may determine when the subtotal is printed.
In the bottom left is a list of alternative reports that can be produced. If you were to have custom reports designed for you, they would be added at the bottom of this list.
Finally, on the bottom right are the printing controls including any options that might apply (none in the case of this window) and report destination icon buttons for screen and printer. If you right-click on either the icon buttons or the Print Report button, you can select any of the report destinations.
Let us now print a listing report to screen of all PO Receipts. Enter a C in first Movement type box and press the tab key. When the To box is empty and you enter anything in the From box, the system defaults the value to what you first entered so a C should be present in both movement type boxes. This will restrict the search to only C-type movements which are PO Receipts. For the remainder, we will use the defaults of; Movement Date sort order, History Listing report type, and Preview report destination. Now click on the Print Report button or press the Enter key. The report results will display on the Preview report window.
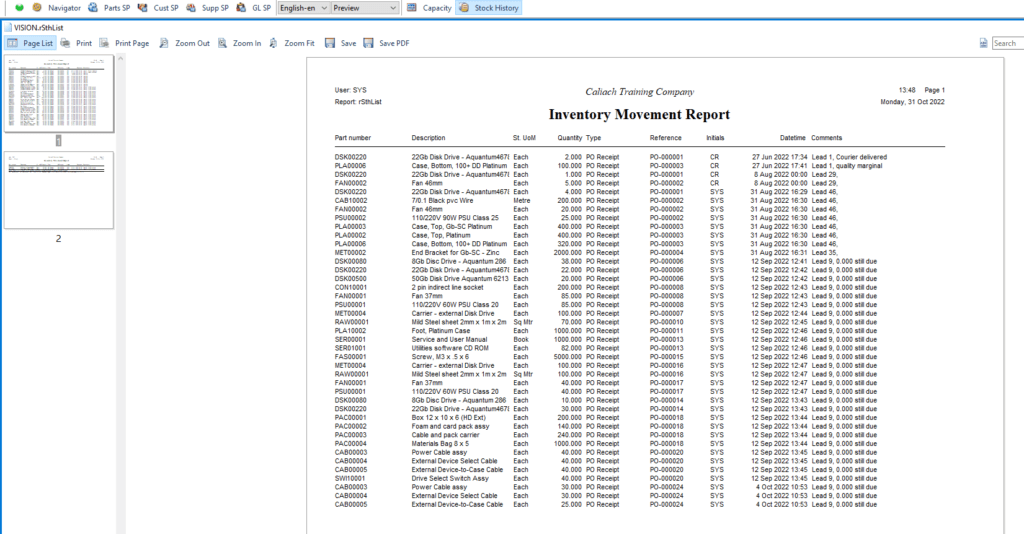
The Preview Report window has a set of seven tools at the top left that respectively:
- Turn on/off the page list panel
- Print the entire report to the printer
- Print the currently viewed page only to the printer
- Zoom Out
- Zoom In
- Zoom to Fit
- Save the report to a Disk file that can later be reviewed or printed with the File→Print Report From Disk menu function.
- Save PDF
The Preview report window has a useful copy feature whereby you can right-click and operate the report menu. Select All to copy a text (or picture) version of the selected report area to the clipboard. This can then be pasted into another programme such as a spreadsheet.
In addition to running the report with a selection, you can also drive the report by dragging and dropping a selection of parts from the Parts ScratchPad onto the report window. When you do this, only the parts selected will be used and in addition the search criteria will apply. So, if you want only the PO receipts for parts with index code 1 equal MATL, with the same inventory history selection, open the Parts ScratchPad, build a new list of all parts, sort by Index 1, select the MATL lines and drag them onto the report selection window.
Although we are working with the Inventory History reports area, all of the characteristics and behaviour illustrated here are the same in virtually all report printing functions within Caliach Vision. The use of ScratchPad drag and drop is universal and often works from several locations. For example purchase history can be driven from the Parts, Supplier and G/L Account ScratchPads.
Keyword Search can also be used to drive reports, so you could produce a list of all purchase history for suppliers where, say, Bolton exists in any of their addresses.
Sales, Purchases, Works and Jobs
Sales, Purchase and Works Orders (but not Jobs) exist in two forms. While they are active with pending delivery or receipt, they exist as live orders that have their own internal data files. When a delivery or receipt takes place, history is created and when orders and/or line items are completed, so they are removed from the live orders data.
Again, with the exception of Jobs, all orders are self-cleaning in the data. A partially received PO therefore, means that the un-received part of the PO is reportable under Process→Purchase Orders→Print PO Reports and Print PO Item Reports and the received part under Process→Goods Receiving and History→Print History Reports.
Jobs do not follow this pattern. Estimates and Jobs remain in the form they were created throughout their life and beyond. As they are being processed, additional inventory and booking history is added and sales history is created when they are invoiced.
Flexibility of Reports
Flexibility in the population of history reports is provided by standard, custom and keyword searches and ScratchPad drag-and-drop. This may, however, occasionally be insufficient for special needs.
As an alternative, custom reports can be designed and linked to the normal report selection windows by out team of specialists.
Where custom reports are inadequate, a custom feature can be written to collect and analyse the data before producing a report. Such custom features integrate into the programme and are available from the User main menu. The next tutorial section touches on custom reports and features in more detail.
Graphing
Caliach Vision incorporates graphing capabilities for both windows and reports. The most useful tool here is accessed from the File→Run Key Performance Indicators menu function.
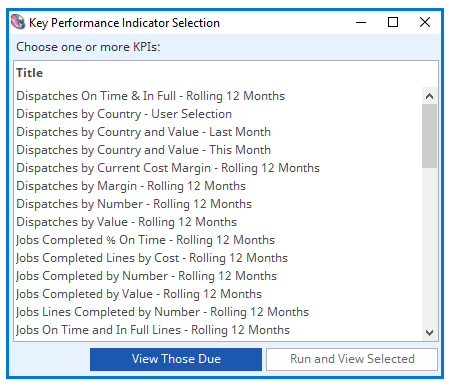
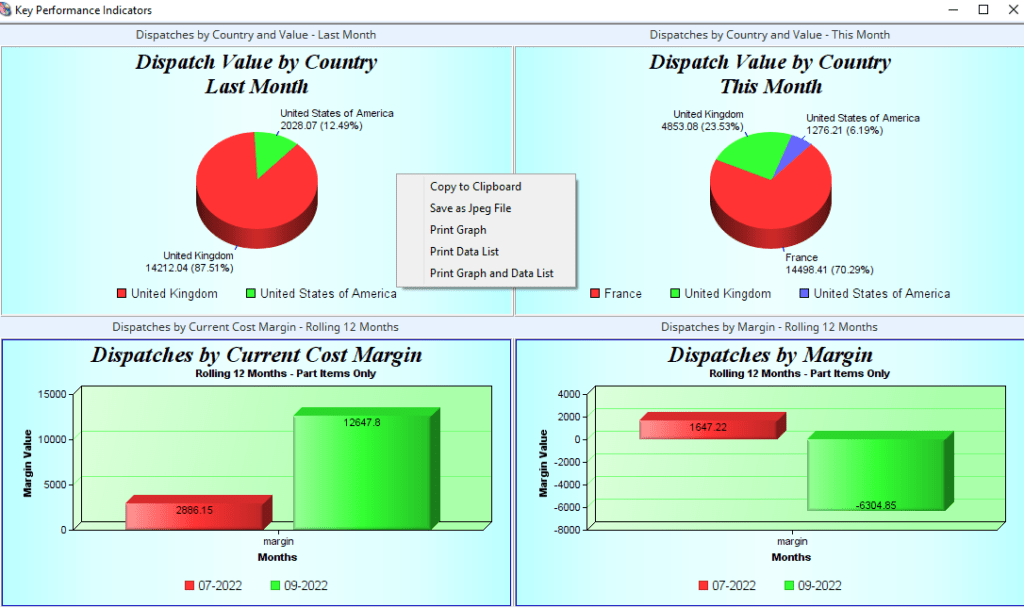
Select the first 4 lines and click on the Run and View Selected button at the bottom right. Four charts will be produced. Right click on the graph to see the print and other options.
Key Performance Indicators are self-defined with a Data View that collects the data and a Graph design that presents the results. They can be tailored exactly to your needs or standards can be imported and then amended in order to suit your needs.
Analysing Data Elsewhere
The database engine has an ODBC (Open Database Connectivity) driver that enables many other programs compliant with this standard, to access Caliach Vision data in real time. For example, MS Excel and Crystal Reports both permit direct operation against Caliach Vision using ODBC.
Even more sophisticated applications can use this technique such as specialist statistical programs and web content managers and servers.
We will move on in the next section of this tutorial to look at how Caliach Vision can fit into your business environment with the numerous preferences and options that can be set and the customisation channels that can be exploited to entirely suit your requirements.